Monitor database performance
Redis Cloud provides a variety of metrics to help you monitor database performance. You can view graphs of performance data at any time and receive emails when performance crosses defined thresholds.
View database metrics
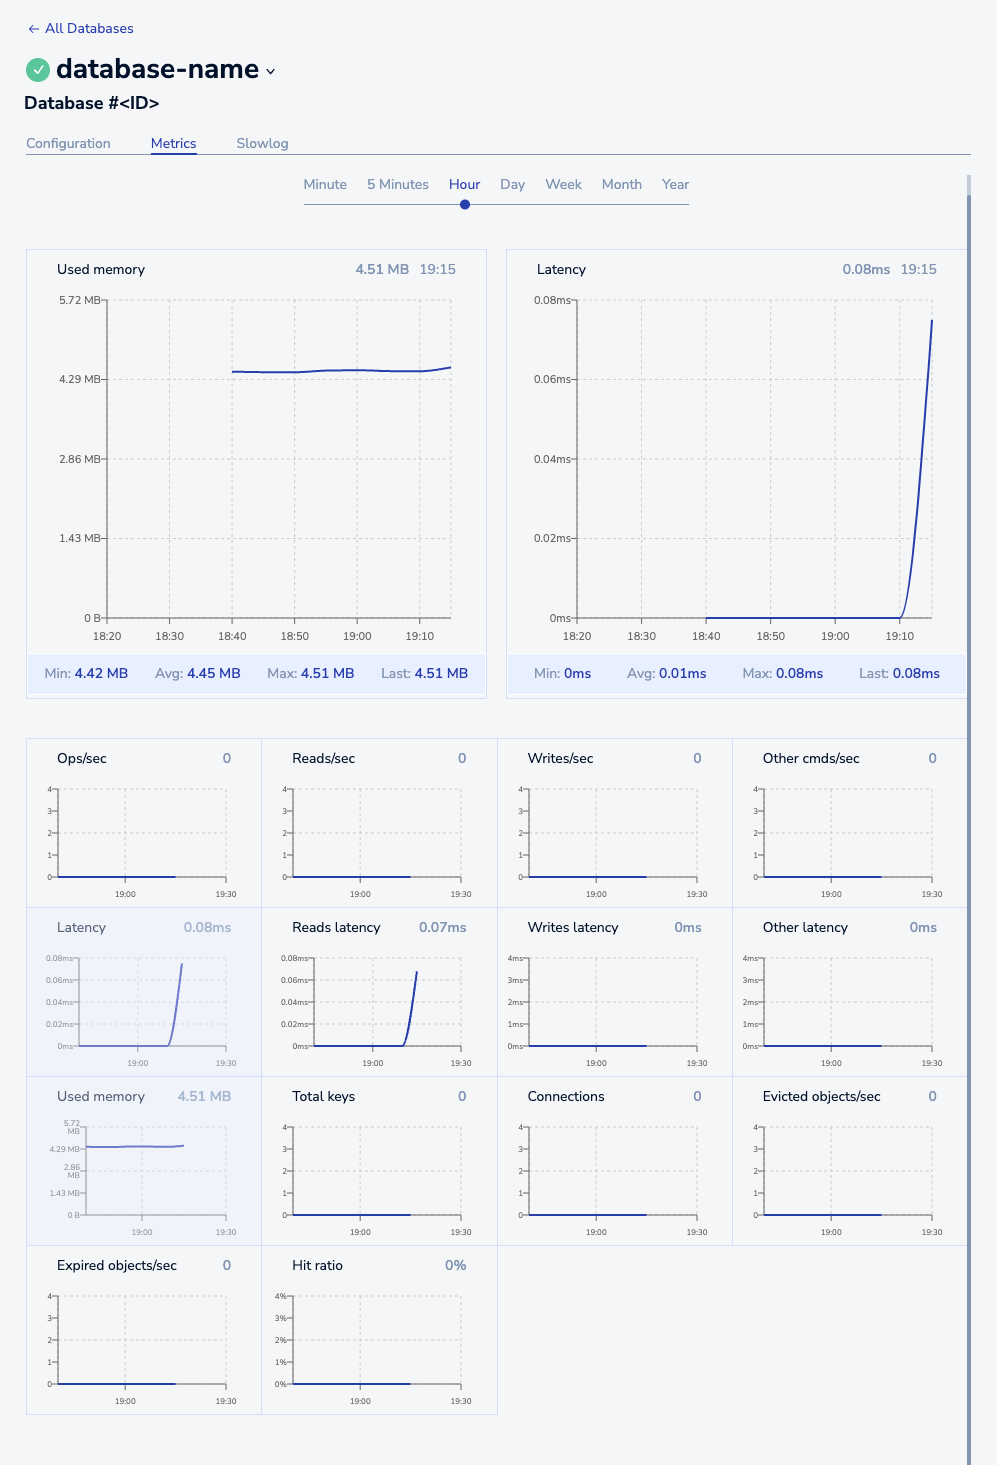
The Metrics tab of the View Database screen provides a series of graphs showing performance data for your database.

Performance data provides insight into how your database is being used and how well it is performing.
The interval scrollbar controls the time period displayed in the graphs.

Promote metric graphs
The Metrics screen shows two primary graphs and a collection of smaller ones. You can promote any smaller graph to a primary position.
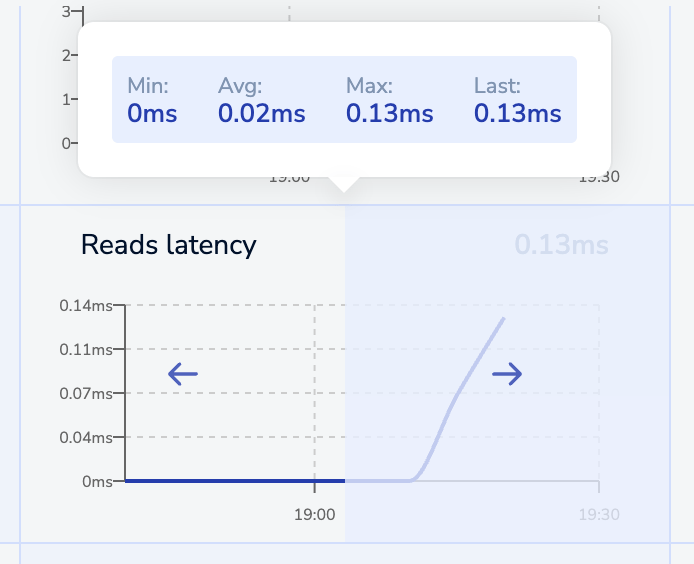
When you use the mouse to point to a smaller graph, three things appear:
- A promotion icon pointing left
- A promotion icon pointing right
- A summary panel showing the minimum, average, maximum, and most recent values displayed in the graph.

Use the promotion icons to promote the smaller graph to one of the primary positions. The left icon promotes the smaller graph to the left position and the right icon promotes the smaller graph to the right position.
Metric definitions
Several metric graphs are available:
| Metric | Description |
|---|---|
| Ops/sec | The number of overall operations per sec for all Redis commands |
| Reads/sec | The number of read operations per second |
| Writes/sec | The number of write operations per second |
| Other cmds/sec | The number of other Redis commands per second |
| Latency | Latency per operation, in milliseconds |
| Reads latency | Latency per read operation, in milliseconds |
| Writes latency | Latency per write operation, in milliseconds |
| Other latency | Latency of other commands, in milliseconds |
| Used memory | Amount of memory used by the database |
| Total keys | Total number of keys in the database |
| Connections | Total number of connections to the endpoint |
| Evicted objects/sec | Number of objects evicted from the database per second. |
| Expired objects/sec | Number of expired objects per second. An expired object is an object with expired TTL that was deleted from the database. |
| Hit ratio | Percent of operations on existing keys out of the total number database operations |
For more detailed analysis, consider using Redis Insight or Prometheus and Grafana.
Configure metric alerts
Depending on your subscription plan, you can enable alerts for several metrics for a given database.
To do so, go to the Configuration tab of the database and then locate the Alerts section. For details, including a breakdown of alerts available for each subscription type, see Alerts section.
Alert settings are specific to a given database. To receive alerts for multiple databases, make sure each is configured accordingly.
Change alert recipients
Any member of the account team can receive alert emails.
To update alert settings for one or more team members, select Access Management from the admin console menu and then select the Team tab. For details, see Access management.
If you subscribe to Redis Cloud through a Platform-as-a-Service (PaaS) provider (such as Heroku), you will need to review your provider's documentation for help managing your team.